Executives, O&M teams, asset managers, EPCs, lenders, and insurers all read Aerox findings differently. Every report is structured so each audience gets exactly the view they need — without wading through the rest.
| Report Layer | What It Includes | Why It Matters |
|---|---|---|
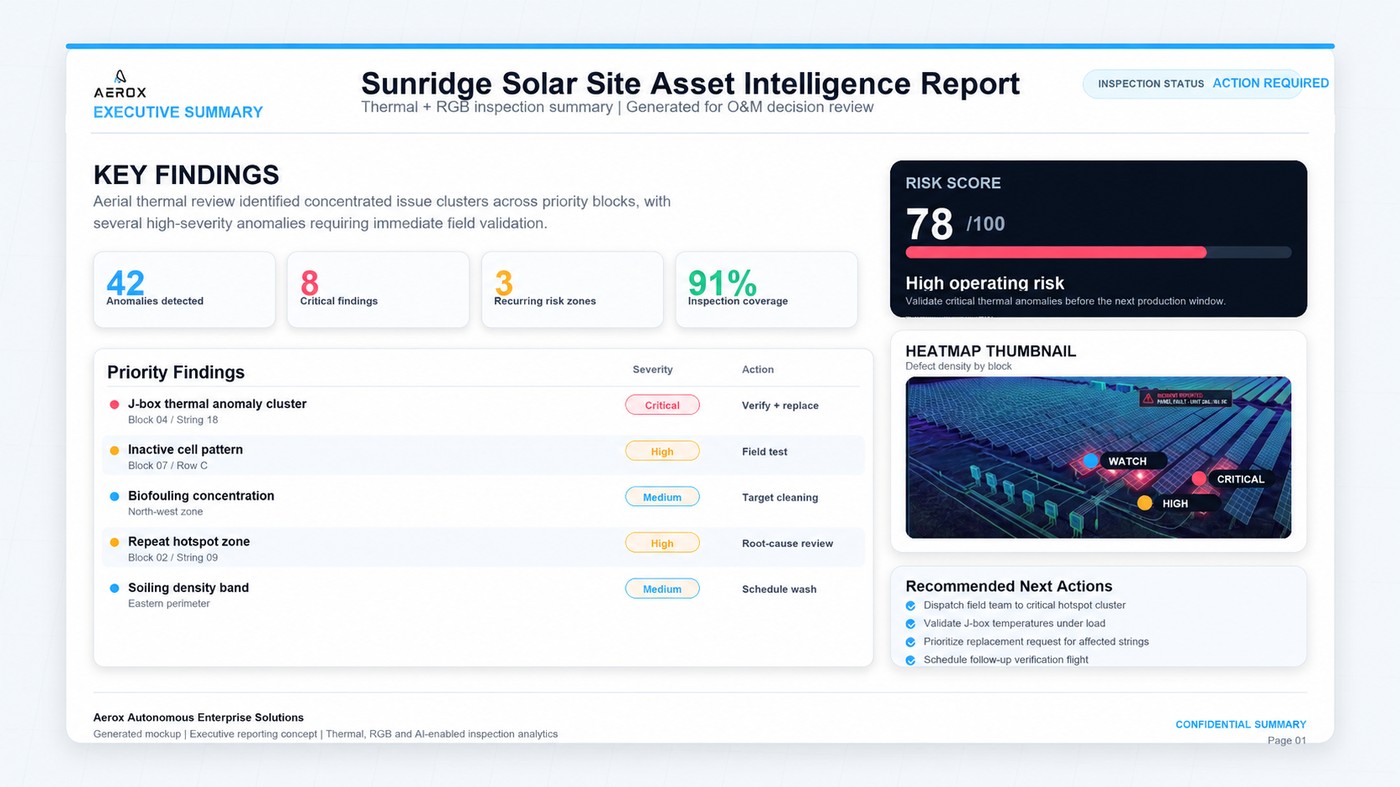
| Executive Summary | Key findings, critical issues, value at risk, recommended next actions, status changes since the last inspection. | Helps senior stakeholders understand risk and approve action quickly. |
| Technical Defect Register | GPS location, issue type, severity, evidence links, confidence notes, recommended action, and ownership. | Gives field teams a practical, fix-first list. |
| Heatmaps & Zone Summaries | Defect density by block, turbine, string, module area, or repeated-risk zone. | Supports targeted maintenance and reduces wasted crew movement. |
| Trend Comparison | What improved, worsened, recurred, or newly appeared since the previous inspection. | Shows whether maintenance is working and where root-cause issues may exist. |
| Evidence Pack | Annotated thermal/RGB images, timestamps, location references, inspection coverage summary, and data archive. | Supports warranties, OEM discussions, insurance, lenders, and compliance needs. |
| Workflow Export | CMMS-ready lists, CSV/API exports, task assignments, procurement triggers, and close-out statuses. | Turns reporting into action rather than another static document. |
Here's what a report pack looks like from a typical 85 MWp baseline-audit scope — clear, actionable, and designed to shorten time-to-action and support repeatable performance tracking.
Key findings, critical issues, and recommended next actions.
Areas covered, dates/times, weather window, and flight overview.
Every issue logged with GPS location, severity rating, and evidence links.
Hotspot clusters, abnormal temperature deltas, and J-box overheating patterns.
Hairline fracture indicators, glass defects, soiling patterns, and asset condition notes.
Flagged zones showing biological growth patterns and performance impact.
Exact GPS locations, severity, and a practical fix-first list.
Risk visibility and trend tracking across the full portfolio.
Financial and operational impact, distilled to what matters.
Defensible, timestamped evidence for claims and compliance.
Structured outputs map directly into maintenance management systems or export for contractor workflows — so an inspection finding becomes a work order, not another PDF sitting in an inbox.
Request a Sample Report Pack